Energy and Light
There is often a lot of confusion between the terms chromatography, spectroscopy, spectrometry, and spectrophotometry. These concepts are intrinsically linked but are still different approaches to looking at (or measuring) matter with light (or energy). The terms are all based around the Greek word origins for color (
chroma-) and light (
photo-) combined with the terms: ‘to write’ (
graphein), ‘to measure’ (
metria), ‘to see’ (
skopia) or the Latin ‘to look at’ (
specere). The different disciplines can be understood as a general sphere of study with levels of increasing specialty or specificity.
Spectrometry (the measurement of the interaction of energy and matter) is the basis for all the other techniques. There are several types of spectrometry defined by their target and method of measurement
. The most common analytical techniques found in the organic laboratory are mass spectrometry and spectroscopy.
Spectroscopy is the study or measurement of the interaction of matter and electromagnet radiation resulting in spectra (wavelength or frequency of the radiation). Sometimes spectroscopy is also described as the study of color from all bands of the electromagnetic radiation (EM) spectrum. Electromagnetic radiation are all waves in the electromagnetic field carrying electromagnetic radiation throughout space. Electromagnetic radiation is made up of oscillating waves of magnetic and electrical fields measured most often by frequency and wavelength.
The Electromagnetic Radiation Spectrum
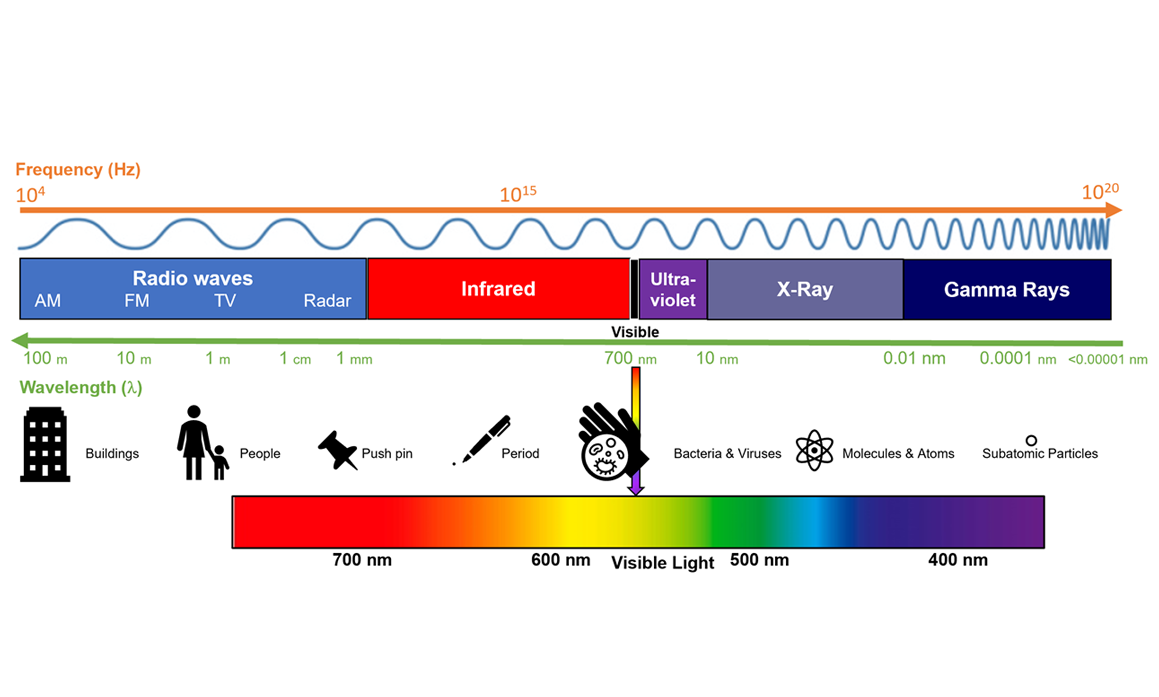
EM radiation spectrum encompasses a wide band of energy including radio waves, microwaves, infrared, visible light, ultraviolet, X-rays and gamma rays. Radio waves at the end of the spectrum have the largest wavelength and the lowest frequency. The size of these radio waves is in the hundreds of meters comparable with the size of buildings. On the other end of the range are gamma rays which are high frequency and so small they cannot be measured since the particles slip between the molecules of measurement devices. (Figure 1).
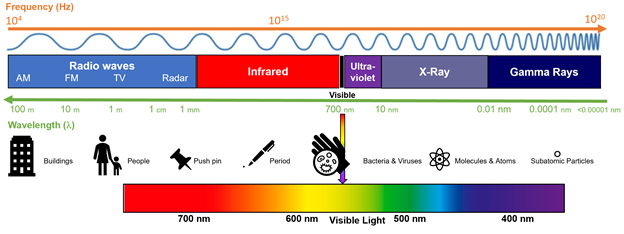
Figure 1. Electromagnetic spectrum.
Many laboratory analytical techniques are focused on range of waves associated with light from infrared to ultraviolet light in the range of 100 nm to 1 mm. This energy encompasses the ultraviolet ranges, visible light, and the infrared spectrum.
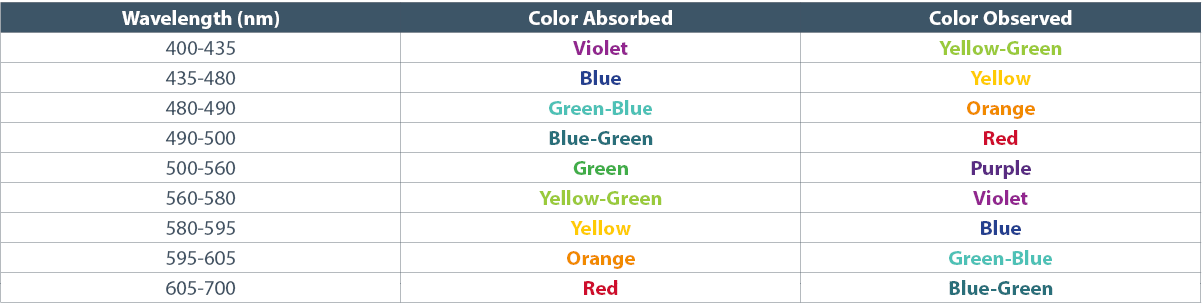
Most animals including human beings can only perceive light within the range of 400-700 nanometers which also gives us the perception of colors when they are absorbed by objects and reflect back as the opposite color (Table 1). We see the color red when light of many spectrums hit something like an apple and all of the other wavelengths of visible light are absorbed while the reds are reflected back for the human eye to see. So when you see red you are actually only seeing it because the surface of that red apple is reflecting back red and absorbing the other colors!
Table 1. Wavelengths of Color